Neel Shah

Hello! I'm Neel, an experienced Data Analyst passionate about extracting insights from data.
Lifelong learner, skilled in math & programming, passionate about data analysis, enjoys tackling complex challenges & creating visualizations.
View My LinkedIn Profile
DeligtfulBites Analysis
Business Background: Embark on a global gastronomic adventure with DelightfulBites, featuring an eclectic array of New York’s finest restaurants spanning diverse cuisines. Each order is a testament to DelightfulBites’ commitment to quality, taste, and prompt delivery. With meticulous data analysis, DelightfulBites ensures a seamless dining experience, focusing on food preparation time, delivery efficiency, and customer ratings. Savour a world of flavours from the comfort of your own home, as DelightfulBites brings New York’s culinary treasures to your doorstep.
Technology Used
| 🔹 Python |
Analysis
Data Loading: Efficiently load and preprocess DelightfulBites’ diverse culinary data for insightful analysis using Python and Jupyter Notebook.
# Load the Required libraries
import pandas as pd
# loading the dataset into pandas dataframe
df = pd.read_csv("food_order.csv")
# Displaying the first 10 rows of the dataset
print(df.head(10))
   order_id  customer_id            restaurant_name   cuisine_type  \
0   1477147       337525                    Hangawi         Korean
1   1477685       358141  Blue Ribbon Sushi Izakaya       Japanese
2   1477070        66393                Cafe Habana        Mexican
3   1477334       106968  Blue Ribbon Fried Chicken       American
4   1478249        76942           Dirty Bird to Go       American
5   1477224       147468           Tamarind TriBeCa         Indian
6   1477894       157711          The Meatball Shop        Italian
7   1477859        89574                  Barbounia  Mediterranean
8   1477174       121706         Anjappar Chettinad         Indian
9   1477311        39705              Bukhara Grill         Indian

   cost_of_the_order day_of_the_week     rating  food_preparation_time  \
0              30.75         Weekend  Not given                     25
1              12.08         Weekend  Not given                     25
2              12.23         Weekday          5                     23
3              29.20         Weekend          3                     25
4              11.59         Weekday          4                     25
5              25.22         Weekday          3                     20
6               6.07         Weekend  Not given                     28
7               5.97         Weekday          3                     33
8              16.44         Weekday          5                     21
9               7.18         Weekday          5                     29

   delivery_time
0             20
1             23
2             28
3             15
4             24
5             24
6             21
7             30
8             26
9             26
Data Description: Explore DelightfulBites’ rich culinary dataset, encompassing restaurant details, cuisine types, costs, ratings, and more for comprehensive analysis.
# Defining the datatypes of the features
print(df.dtypes)
order_id                   int64
customer_id                int64
restaurant_name           object
cuisine_type              object
cost_of_the_order        float64
day_of_the_week           object
rating                    object
food_preparation_time      int64
delivery_time              int64
dtype: object
# Defining the null rate function
def null_rate(df):
    null_count = df.isnull().sum()
    total_count = len(df)
    null_rate = null_count / total_count * 100
    return null_rate
# Calling the function
print(null_rate(df))
order_id                 0.0
customer_id              0.0
restaurant_name          0.0
cuisine_type             0.0
cost_of_the_order        0.0
day_of_the_week          0.0
rating                   0.0
food_preparation_time    0.0
delivery_time            0.0
dtype: float64
# Identifying the unique values
print(df.nunique())
order_id                 1898
customer_id              1200
restaurant_name           178
cuisine_type               14
cost_of_the_order         312
day_of_the_week             2
rating                      4
food_preparation_time      16
delivery_time              19
dtype: int64
Data Manipulation: Harness the power of Python and Jupyter Notebook to transform, cleanse, and reshape DelightfulBites’ culinary data, paving the way for meaningful insights and informed decision-making.
# Define a lambda function to calculate total time
total_time = lambda row: row["food_preparation_time"] + row["delivery_time"]

# Apply the lambda function to create a new "total_time" column
df["total_time"] = df.apply(total_time, axis=1)

# Print the first 10 rows of the updated DataFrame to check the new column
print(df.head(10))
   order_id  customer_id            restaurant_name   cuisine_type  \
0   1477147       337525                    Hangawi         Korean
1   1477685       358141  Blue Ribbon Sushi Izakaya       Japanese
2   1477070        66393                Cafe Habana        Mexican
3   1477334       106968  Blue Ribbon Fried Chicken       American
4   1478249        76942           Dirty Bird to Go       American
5   1477224       147468           Tamarind TriBeCa         Indian
6   1477894       157711          The Meatball Shop        Italian
7   1477859        89574                  Barbounia  Mediterranean
8   1477174       121706         Anjappar Chettinad         Indian
9   1477311        39705              Bukhara Grill         Indian

   cost_of_the_order day_of_the_week     rating  food_preparation_time  \
0              30.75         Weekend  Not given                     25
1              12.08         Weekend  Not given                     25
2              12.23         Weekday          5                     23
3              29.20         Weekend          3                     25
4              11.59         Weekday          4                     25
5              25.22         Weekday          3                     20
6               6.07         Weekend  Not given                     28
7               5.97         Weekday          3                     33
8              16.44         Weekday          5                     21
9               7.18         Weekday          5                     29

   delivery_time  total_time
0             20          45
1             23          48
2             28          51
3             15          40
4             24          49
5             24          44
6             21          49
7             30          63
8             26          47
9             26          55
Statistics: Dive into DelightfulBites’ data using Python and Jupyter Notebook to uncover valuable statistical insights, illuminating trends, patterns, and key metrics that drive culinary excellence.
# Extract the unique values in the "cuisine" column
cuisine_types = df["cuisine_type"].unique()

# Print the unique cuisine types
print(cuisine_types)
['Korean' 'Japanese' 'Mexican' 'American' 'Indian' 'Italian'
 'Mediterranean' 'Chinese' 'Middle Eastern' 'Thai' 'Southern' 'French'
 'Spanish' 'Vietnamese']
# Group the data by cuisine and count the number of unique restaurants in each group
restaurants_per_cuisine = df.groupby("cuisine_type")["restaurant_name"].nunique()

# Print the result
print(restaurants_per_cuisine)
cuisine_type
American          41
Chinese           16
French             3
Indian            14
Italian           31
Japanese          29
Korean             5
Mediterranean      5
Mexican           11
Middle Eastern     7
Southern           2
Spanish            3
Thai               9
Vietnamese         3
Name: restaurant_name, dtype: int64
Visualization: Employ Python and Jupyter Notebook to craft captivating visual representations of DelightfulBites’ culinary data, enabling intuitive exploration and clear communication of trends, flavors, and customer preferences.
# Import the required library for visualization
import matplotlib.pyplot as plt
# Create a pie chart of the count of restaurants per cuisine type
plt.pie(restaurants_per_cuisine, labels=restaurants_per_cuisine.index, autopct='%1.1f%%')
plt.title("Number of Restaurants per Cuisine Type")
plt.show()
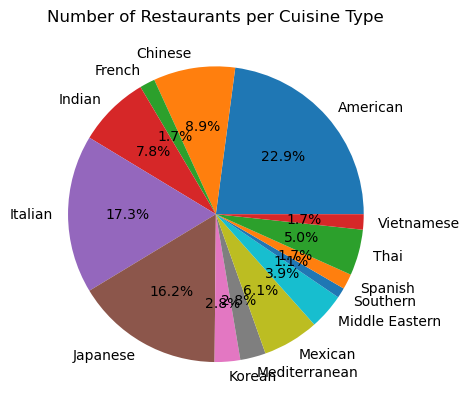
# Select the top 5 cuisine types based on the count of unique restaurants
top_cuisines = restaurants_per_cuisine.nlargest(5)

# Print the top 5 cuisine types with the count of unique restaurants
print(top_cuisines)
cuisine_type
American    41
Italian     31
Japanese    29
Chinese     16
Indian      14
Name: restaurant_name, dtype: int64
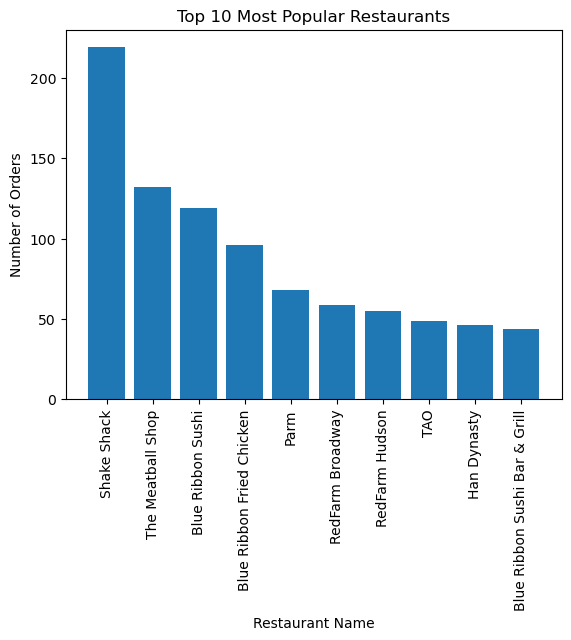
# Count the number of occurrences of each restaurant name
restaurant_counts = df["restaurant_name"].value_counts()

# Select the top 10 restaurants based on the count of occurrences
top_restaurants = restaurant_counts.nlargest(10)

# Create a bar chart of the top 10 restaurants
plt.bar(top_restaurants.index, top_restaurants.values)
plt.xticks(rotation=90)
plt.xlabel("Restaurant Name")
plt.ylabel("Number of Orders")
plt.title("Top 10 Most Popular Restaurants")
plt.show()
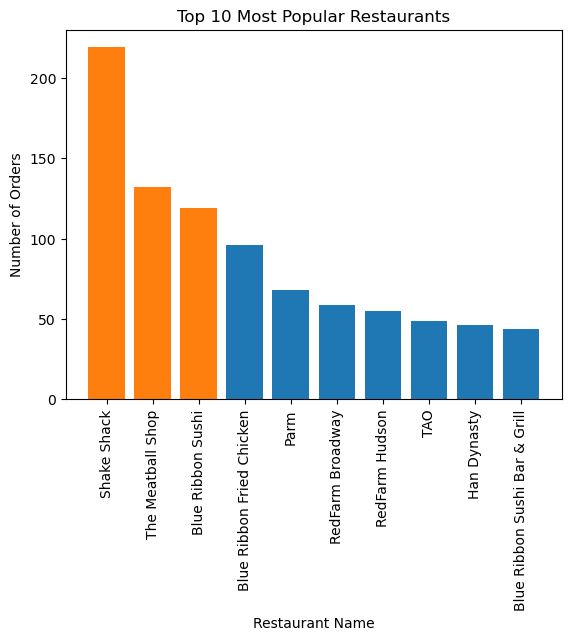
# Create a bar chart of the top 10 restaurants, with different colors for the top 3
colors = ["tab:blue"] * len(top_restaurants)
colors[:3] = ["tab:orange"] * 3

plt.bar(top_restaurants.index, top_restaurants.values, color=colors)
plt.xticks(rotation=90)
plt.xlabel("Restaurant Name")
plt.ylabel("Number of Orders")
plt.title("Top 10 Most Popular Restaurants")
plt.show()
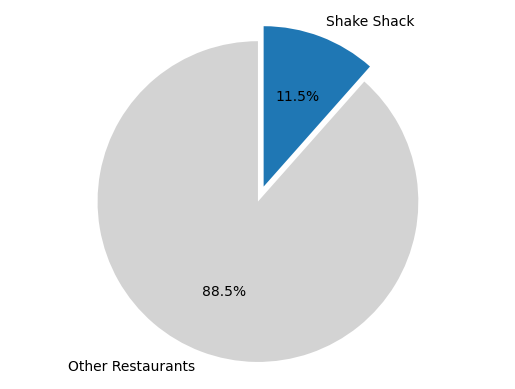
# Count the number of reviews for each restaurant
restaurant_counts = df["restaurant_name"].value_counts()

# Calculate the proportion of reviews for Shake Shack
shake_shack_reviews = restaurant_counts["Shake Shack"]
total_reviews = restaurant_counts.sum()
shake_shack_proportion = shake_shack_reviews / total_reviews

print(f"The proportion of reviews for Shake Shack is {shake_shack_proportion:.2%}")
The proportion of reviews for Shake Shack is 11.54%
# Create the pie chart
labels = ["Other Restaurants", "Shake Shack"]
sizes = [1 - shake_shack_proportion, shake_shack_proportion]
colors = ["lightgray", "tab:blue"]
explode = (0, 0.1)
plt.pie(sizes, labels=labels, colors=colors, explode=explode, autopct="%1.1f%%", startangle=90)
plt.axis("equal")

# Display the pie chart
plt.show()
# Drop rows with "Not given" in the rating feature
df = df[df['rating'] != 'Not given']

# Convert the rating feature to float
df['rating'] = df['rating'].astype(float)

# Calculate the correlation between food_prep_time and rating
corr = df['food_preparation_time'].corr(df['rating'])

# Round off the correlation coefficient to 2 decimal places
corr_rounded = round(corr, 2)

# Print the correlation
print("Correlation between food_prep_time and rating: ", corr_rounded)
Correlation between food_prep_time and rating: -0.01
A correlation coefficient of -0.01 between food preparation time and rating indicates a very weak negative correlation between the two variables. This means that there is little to no linear relationship between the amount of time it takes to prepare the food and the rating given by customers.
Conclusion
In the realm of DelightfulBites, a culinary tapestry woven with data-driven insights reveals intriguing narratives. American cuisine emerges as the dominant protagonist, boasting 41 flourishing restaurants that grace the vibrant landscape. Amidst this flavorful symphony, Shake Shack emerges as the shining star, captivating palates and hearts alike. With an impressive 11.5% share of the culinary limelight, it stands as the beacon of culinary excellence within this delectable journey. The data paints a portrait of culinary diversity, where American cuisines thrive and Shake Shack reigns as the revered cornerstone, elevating the essence of DelightfulBites to captivating heights. 🍔🌮🍕🍟🍗